
Stop Guessing Capacity.
Deliver Every Project on Time.
Know exactly who is free, who is overloaded, and whether next quarter’s pipeline is deliverable. Real-time capacity planning tied directly to timesheets, rate cards, and project milestones.
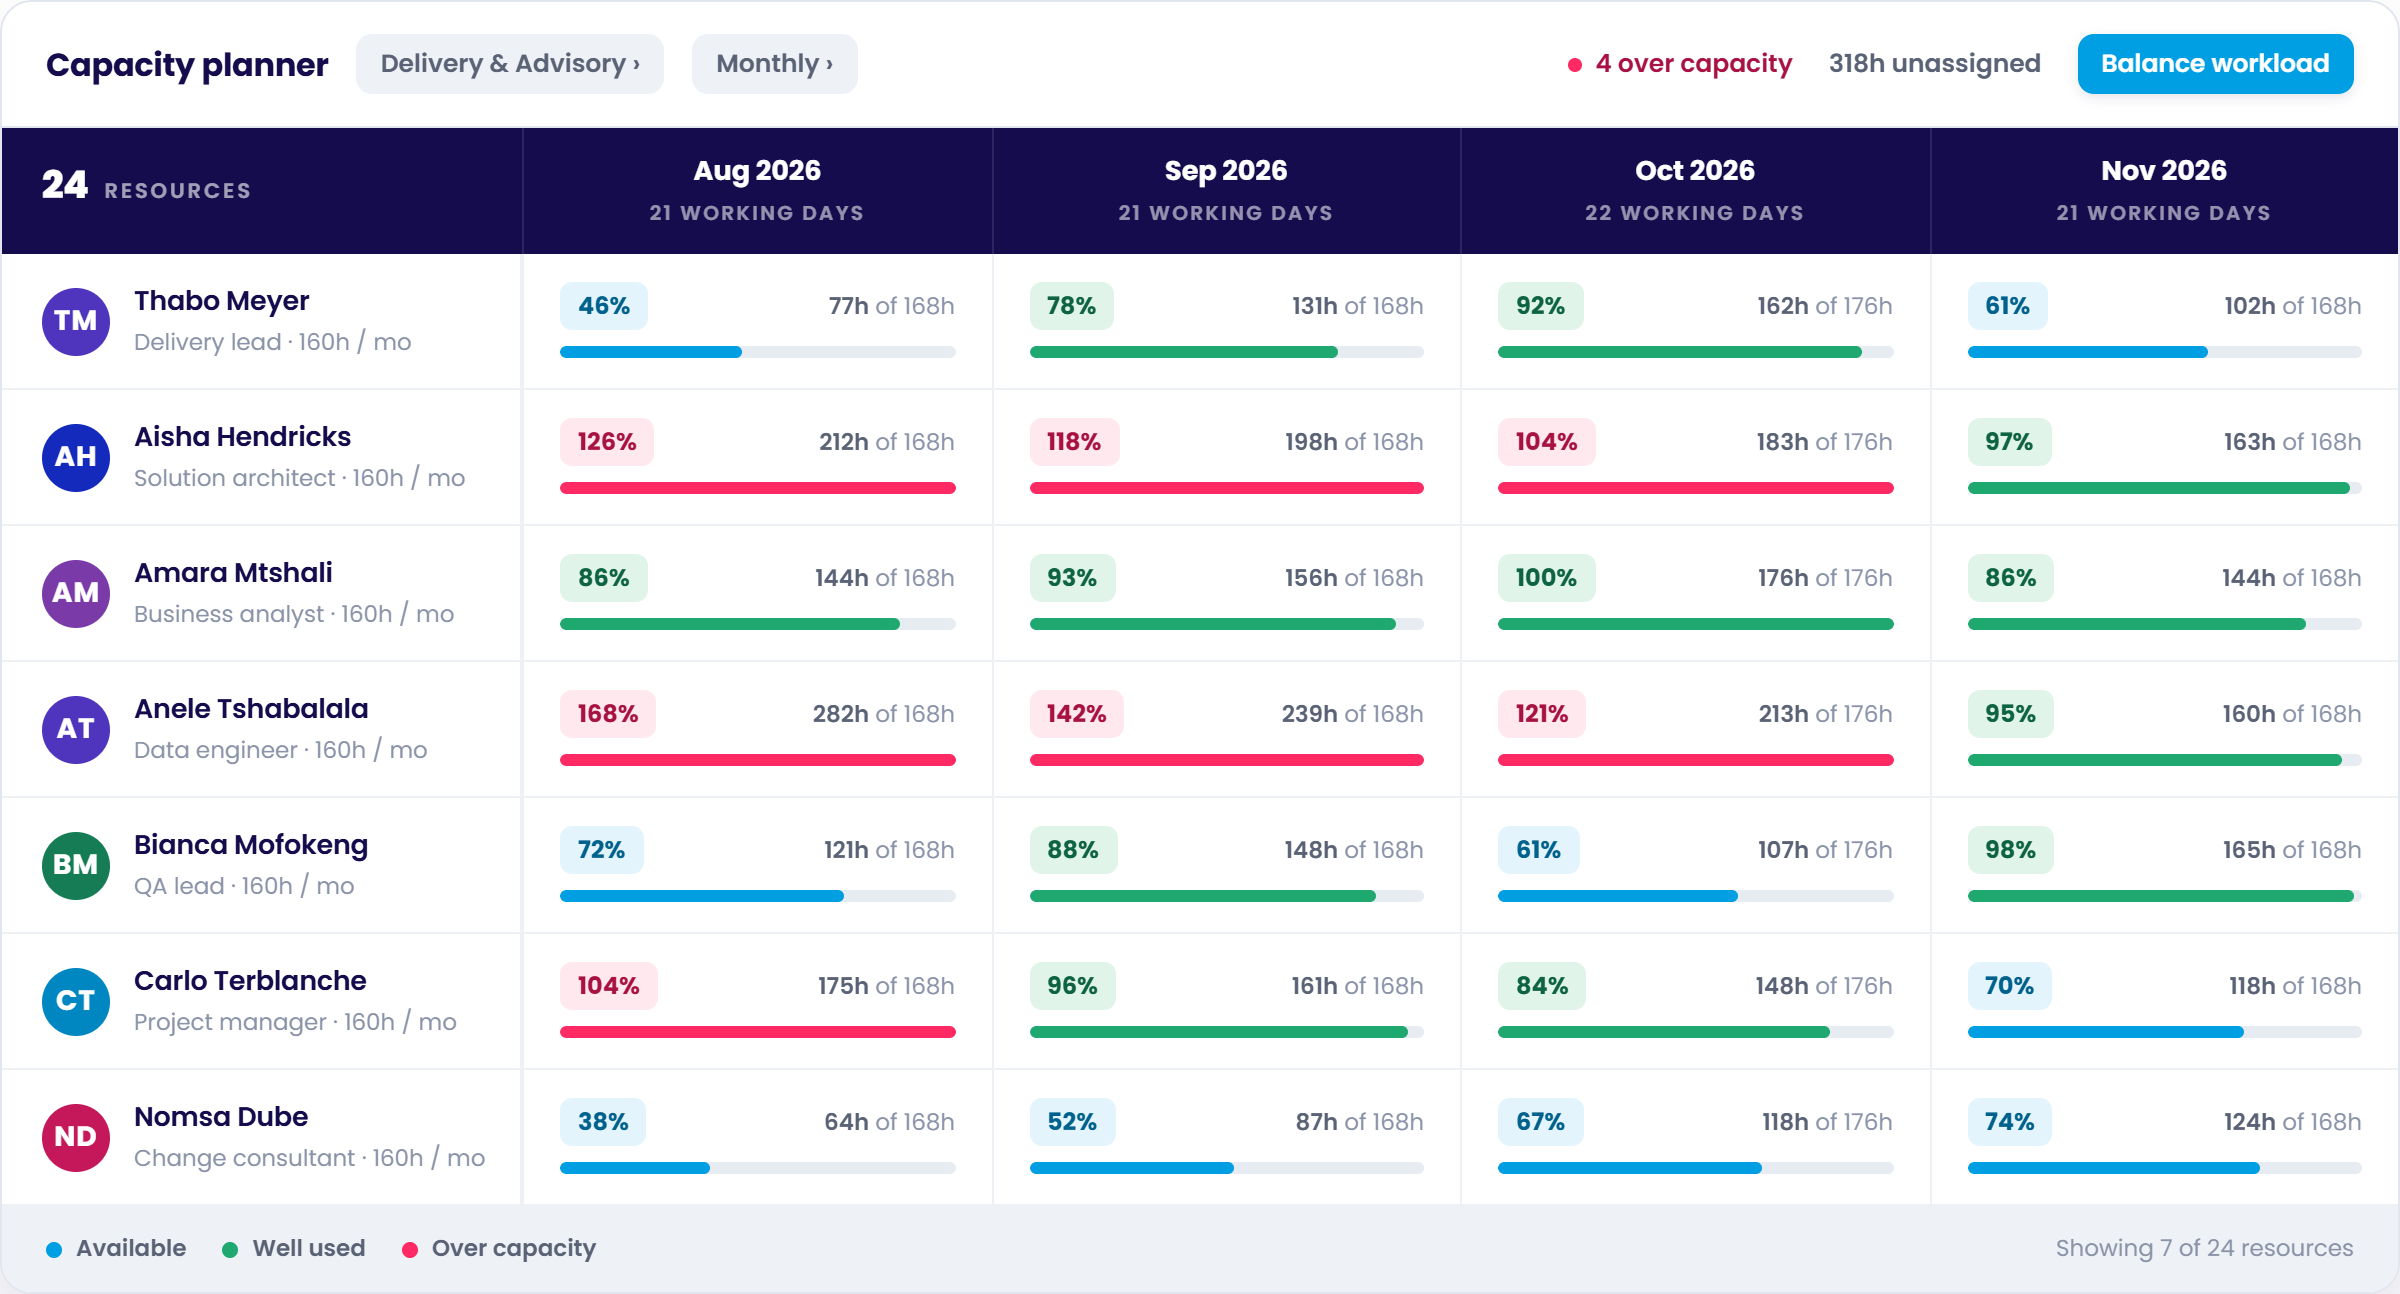
The spreadsheet everyone is quietly maintaining
Most professional services firms manage capacity in disconnected spreadsheets. Within two weeks, project dates shift, leave is approved, and the spreadsheet is silently obsolete.
The Spreadsheet Trap
- Invisible double-booking: Three project leads assume they have the same senior engineer next month until delivery stalls.
- Late-stage firefighting: Conflicts are discovered during launch week, forcing emergency overtime or missed client deadlines.
- Flattered, untrusted numbers: Quarter-end reports use theoretical 40-hour weeks instead of actual hours net of leave.
- Manual reconciliation: Hours booked in sheets must be constantly re-keyed into timesheets and billing tools.
The Chronodesk Operating Model
- Live single source of truth: Allocations, timesheets, and rate cards run on the same database record in real time.
- Cross-project conflict engine: Over-allocations trigger instant visual warnings and actionable rebalancing moves.
- Actual available capacity: Automatically deducts regional public holidays and approved leave from base hours.
- Revenue & margin forecasting: Allocations carry hourly tariffs so resourcing and financial planning happen simultaneously.
Granular Day-by-Day Scheduling Across All Active Projects
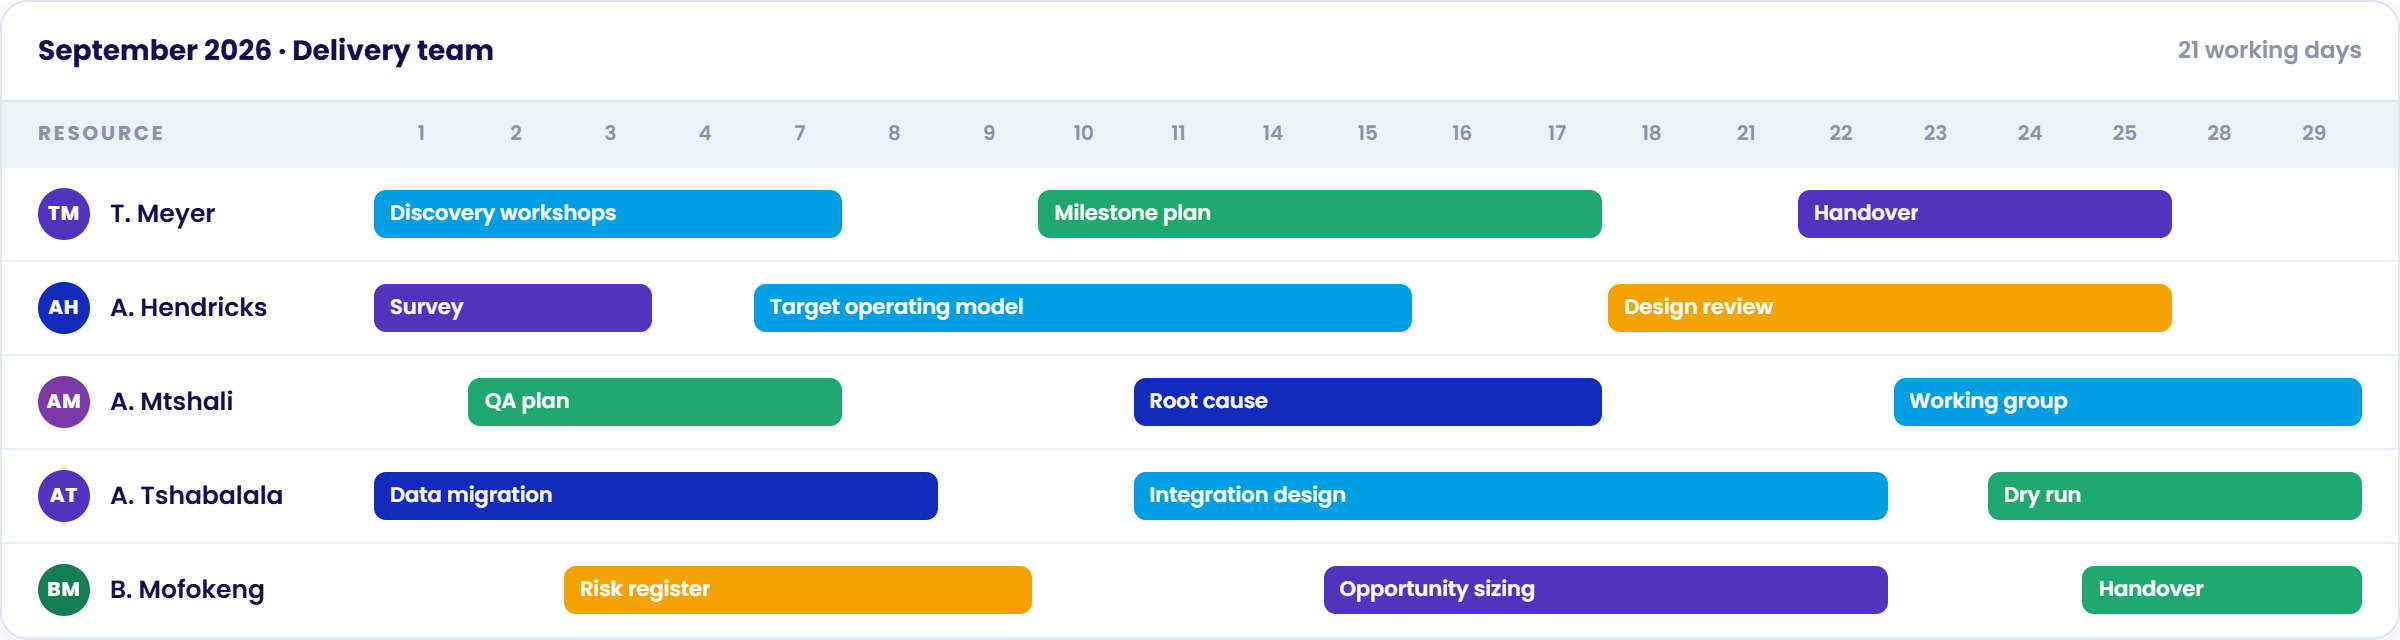
People are assigned to work across engagements, not isolated to a single project plan. Chronodesk gives you a multi-person Gantt calendar displaying exact daily assignments, milestones, float, and handovers.
Working-day awareness: View exact delivery days (e.g. 21 working days in September) without skew from weekends.
Color-coded activity blocks: Easily distinguish Discovery Workshops, Milestone Plans, Target Operating Models, and QA Sign-offs.
Milestone handover alignment: Track team handovers sequentially so downstream engineers aren't left waiting on prerequisites.
Spot Capacity Crunches 6 Months in Advance
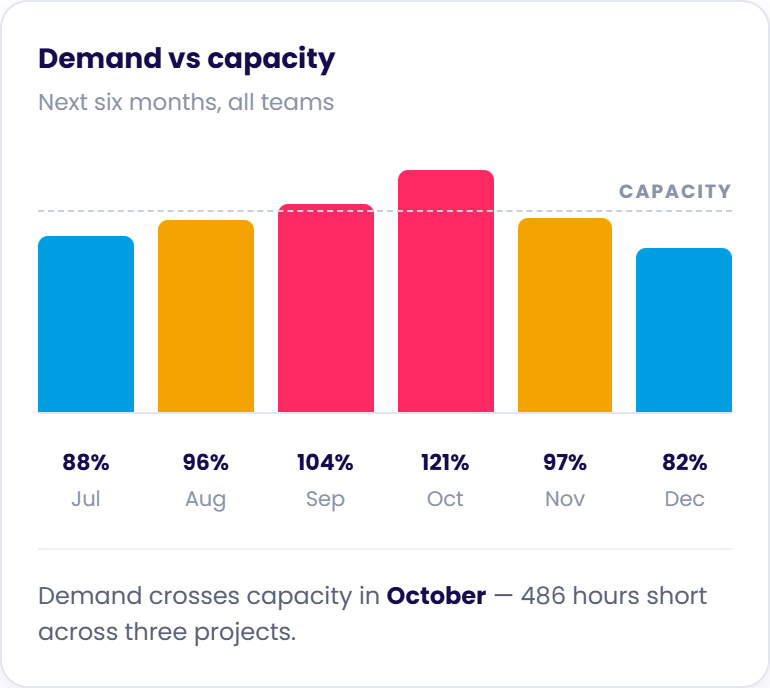
Never promise another delivery date based on guesswork. Chronodesk aggregates committed project hours and pipeline demand to forecast your organization’s workload over the next six months.
Early threshold alerts: Pinpoint the exact month demand will exceed capacity (e.g. October at 121% — 486 hours short).
Data-backed hiring: Justify contractor engagements or permanent hiring weeks before production lines freeze.
Pipeline reality check: Check new client proposals against existing delivery commitments before signing contracts.
Resolve Allocation Conflicts with 1-Click Actions
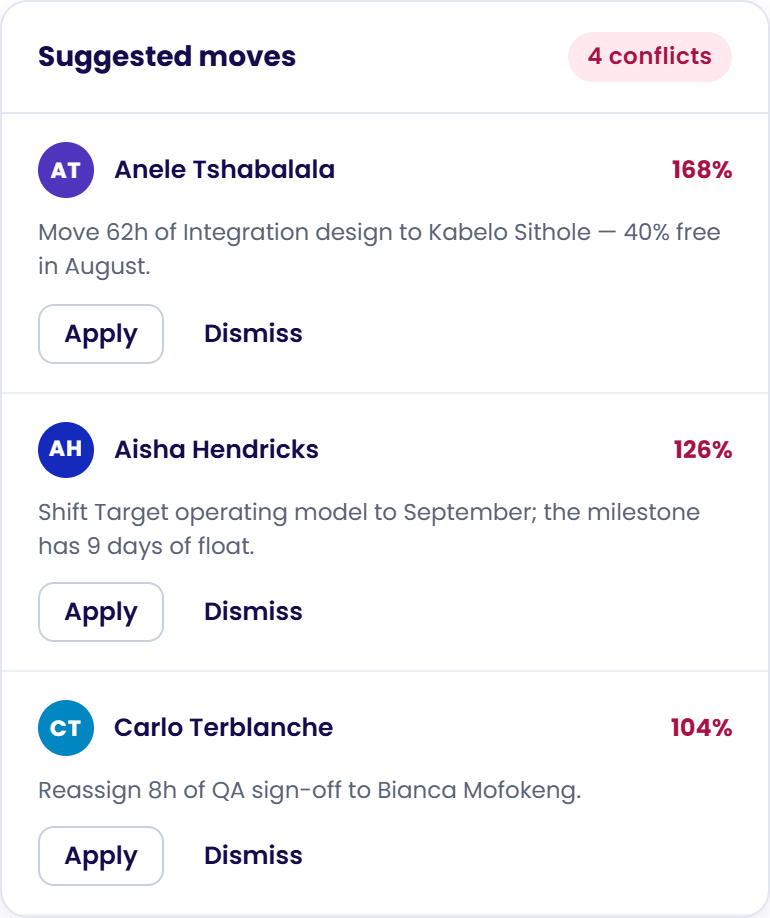
When team members are over-allocated, Chronodesk doesn’t just show red flags — it actively calculates and recommends the smartest rebalancing moves to protect your delivery schedule.
Automated capacity matching: Identifies unutilized colleagues (e.g. moving 62h to Kabelo Sithole who is 40% free).
Schedule float analysis: Recommends shifting non-critical milestones that carry schedule float without risking deadlines.
Apply or dismiss: Accept recommendations with one click, immediately updating Gantt schedules and timesheet targets.
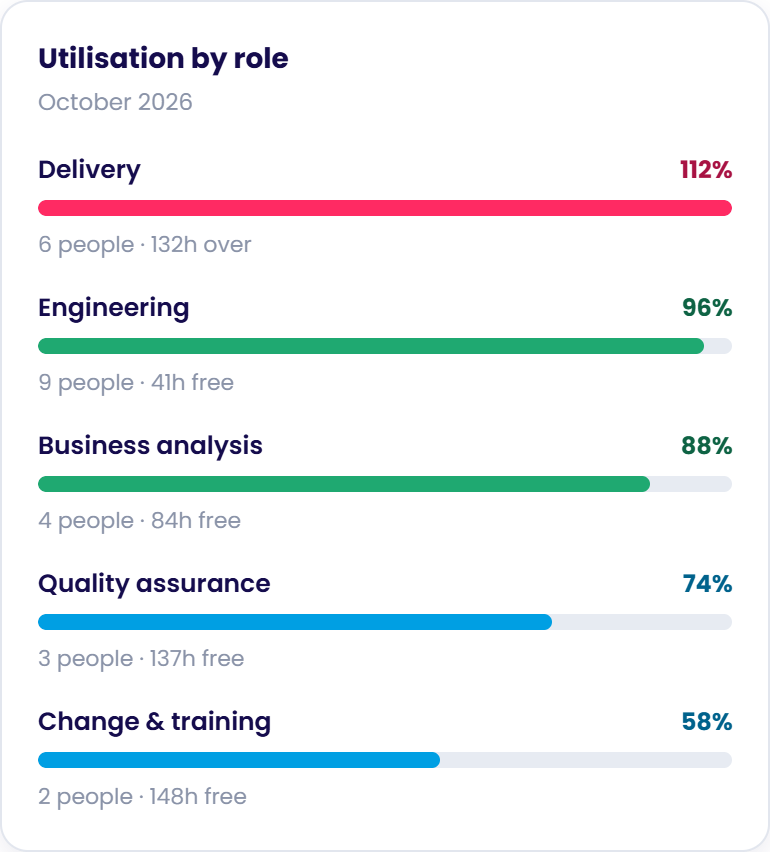
Role & Discipline Utilisation Tracking
Gain executive clarity on how each department is performing. See which skill sets are overloaded and which disciplines have available hours ready to sell.
Discipline-level visibility: Break down utilization across Delivery (112%), Engineering (96%), BA (88%), QA (74%), and Change (58%).
Free hours discovery: Quantify exact available hours per role (e.g. 137h free in QA, 148h in Change) to guide business development.
Prevent role burnout: Intervene when delivery leads consistently exceed 110% before client engagement suffers.
The Science of Billable Utilisation
For consulting, engineering, and digital agency teams, targeting the right utilisation band is the single largest lever on agency profitability and team retention.
The Unbilled Bench
The firm carries more payroll than it is selling. Either the sales pipeline has dried up or the bench has unneeded capacity. Unchecked, this rapidly erodes operating margins.
Maximum Healthy Profit
The industry gold standard. Healthy billable delivery to maximize profitability, while leaving ample slack for pre-sales bids, skills training, internal R&D, and annual leave.
Burnout Danger Zone
Zero slack in the system. Project quality slips, documentation stops, technical debt builds, and key senior engineers resign within two quarters from chronic fatigue.
How Chronodesk Calculates Real Utilisation
Using a notional 40-hour week distorts reality. Chronodesk subtracts verified leave and statutory holidays at capture time in timesheets so your reports show true operational execution.
Why standalone resourcing tools create dead ends
Standalone capacity planning tools stop at the plan. In Chronodesk, resource bookings automatically sync with CRM quotes, project Gantt timelines, timesheet submissions, and client billing.
1. Pre-Sales Pipeline
Check live bench availability before signing MSAs. Ensure your delivery team can deliver before sales promises fixed start dates.
Explore CRM2. Project Execution
Work breakdown structure and Gantt dependencies sync with resource allocations. Shifting a milestone automatically updates capacity plans.
Explore Projects3. Live Timesheets
Team members log time against their assigned allocation blocks. Planned vs. actual variance is tracked automatically without monthly reconciliations.
Explore Timesheets4. Billing & Realisation
Role-based and client-specific rate cards turn booked hours into revenue forecasts, surfacing unbilled write-offs before invoices are generated.
Explore PricingWhich plan includes Resource Management?
Resource Management & Capacity Planning is included on the Chronodesk Advanced plan at $40 (R600) per user per month.
Resource Management Software FAQ
What is resource management software?
Resource management software is a centralized system that plans, allocates, and optimizes human and technical capital across projects. It compares each person's true available hours (net of holidays and approved leave) against commitments across all active engagements. It alerts project leads to over-allocations before deadlines slip and measures billable utilisation once work is logged in timesheets.
How does capacity planning differ from resource allocation?
Capacity planning is the aggregate, strategic view: evaluating whether your firm has enough total hours across specific skills (e.g., solution architects, QA leads) to take on upcoming client demand over the next 3 to 6 months. Resource allocation is the granular, operational execution: booking specific named individuals to exact tasks, milestones, and dates on active projects.
What is a healthy billable utilisation rate for professional services?
For billable consultants and engineers, 70–80% is the industry standard sweet spot (75% being the most common target). Operating below 60% indicates excess unbilled bench capacity draining profit margins. Conversely, sustaining utilisation above 85% leaves zero buffer for training, pre-sales, internal innovation, or unexpected illness—inevitably leading to quality degradation, burnout, and staff attrition.
How does Chronodesk calculate utilisation rate?
Utilisation is calculated as Billable Logged Hours divided by Available Contracted Hours for a specific person and timeframe. Chronodesk automatically computes Available Hours by subtracting regional public holidays and approved annual/sick leave from base contracted hours. Because actuals are pulled directly from approved timesheets rather than estimates, your utilisation figures reflect real operational delivery.
How do Chronodesk's Suggested Moves and conflict resolution work?
When team members are booked beyond 100% capacity, Chronodesk highlights the bottleneck and provides automated, 1-click rebalancing suggestions. The system checks task float along the critical path to suggest date shifts, or identifies qualified team members who have spare capacity in that period to recommend instant reassignments.
Which Chronodesk plan includes resource management?
Resource Management is available on the Advanced plan at $40 (R600) per user per month. It includes the complete Capacity Planner, PMO & Project Portfolio Management, Work Breakdown Structure (WBS), SLA management, Contract & Retainer tracking, Custom Forms, and full API access. Timesheets and rate cards are included across all plans starting from Essential ($15 / R225 per user/month).
Plan your next quarter against real capacity.
Join hundreds of high-performance project teams that use Chronodesk to protect margins, eliminate burnout, and deliver on time.
No setup fees · Month-to-month flexibility · Guided onboarding included